Working with ER Diagrams
ER Diagram is a visual representation of data that describes how data is related to each other. In ER Model, we disintegrate data into entities, attributes and setup relationships between entities, all this can be represented visually using the ER diagram.
For example, in the below diagram, anyone can see and understand what the diagram wants to convey: Developer develops a website, whereas a Visitor visits a website.
Components of ER Diagram
Entitiy, Attributes, Relationships etc form the components of ER Diagram and there are defined symbols and shapes to represent each one of them.
Let's see how we can represent these in our ER Diagram.
Entity
Simple rectangular box represents an Entity.
Relationships between Entities - Weak and Strong
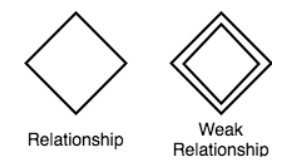
Rhombus is used to setup relationships between two or more entities.
Attributes for any Entity
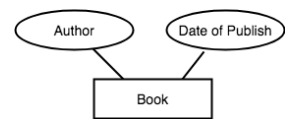
Ellipse is used to represent attributes of any entity. It is connected to the entity.
Weak Entity
A weak Entity is represented using double rectangular boxes. It is generally connected to another entity.
Key Attribute for any Entity
To represent a Key attribute, the attribute name inside the Ellipse is underlined.
Derived Attribute for any Entity
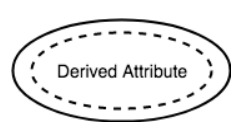
Derived attributes are those which are derived based on other attributes, for example, age can be derived from date of birth.
To represent a derived attribute, another dotted ellipse is created inside the main ellipse.
Multivalued Attribute for any Entity
Double Ellipse, one inside another, represents the attribute which can have multiple values.
Composite Attribute for any Entity
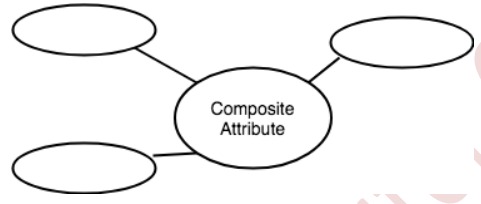
A composite attribute is the attribute, which also has attributes.
"ER diagram symbols"
"ER diagram symbols and notation"
"ER diagram examples with solutions"
"ER diagram examples "
"attributes in ER diagram"
"cardinality in ER diagram"
"how to draw ER diagram"


